Portfolytics
LiveShopify app that analyzes store sales by category and creates an interactive dashboard automatically based on main menu structure
Starting Point
Shopify merchants can't directly see which product categories perform best relative to their assortment. Shopify's own analytics tools show total sales and product-level numbers, but category-level comparison — for example, "Home generates 4.5x more revenue per product than Kids" — requires manual work or expensive enterprise tools.
Especially for mid-size stores with hundreds or thousands of products across multiple categories, there was no tool that answered the question: which categories have excess assortment and which ones are worth expanding?
Why This Was a Problem
Without category analytics, merchants make assortment decisions based on gut feeling. They might advertise categories with lots of products but weak sales per product, while the most efficient categories go unnoticed. This leads to wasted marketing spend and missed sales opportunities.
How I Approached the Problem
I researched existing solutions in the Shopify App Store and found that no app offered automatic hierarchy analysis where the category structure is pulled directly from the store's main menu without manual configuration. Competing analytics apps either required heavy manual setup or offered only product-level reports without a category view.
Honestly, I largely built the product first and started validating demand later. This was an instructive mistake that I'll return to below.
What Was Built
The app's core idea is simple: a merchant installs it and immediately sees which categories produce and which don't. No settings, no configuration, no "first create categories manually" steps.
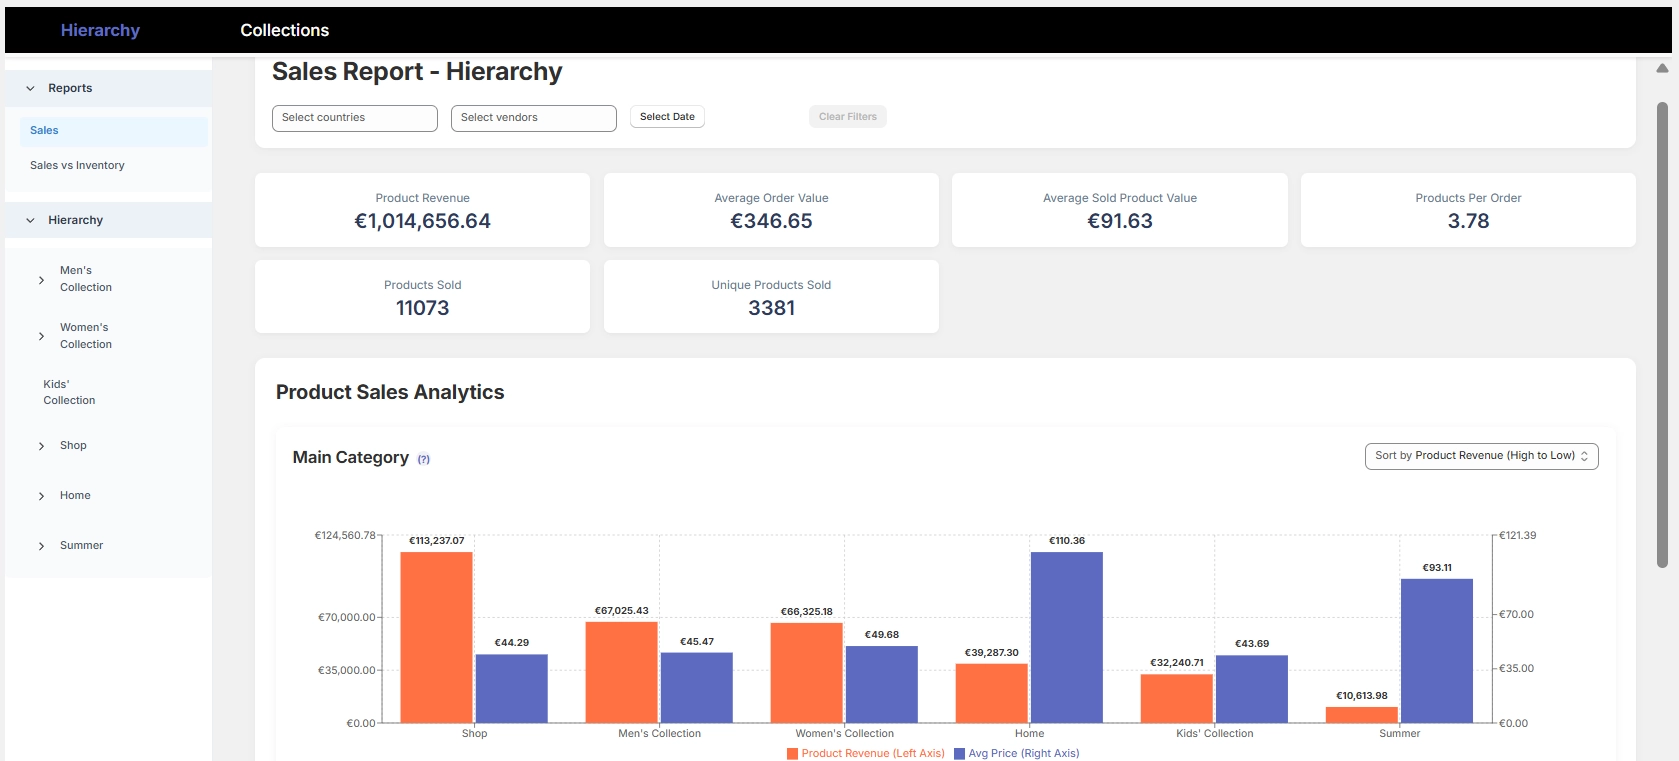
In practice, the app reads the store's main menu and infers the category hierarchy from it. On top of this, it builds four reports across two views:
Hierarchy reports answer the question "how do my sales distribute according to my main menu structure?" A merchant can see at a glance that, for example, the Home category generates €437 per listed product while Kids generates only €97 — even though Kids has 7x more products. This kind of insight directly tells you where your assortment is efficient and where it's bloated.
Collection reports show the same at Shopify's collection level. Merchants can also see the performance of collections that don't appear in the main menu but still have products and marketing budget tied to them.
In the dashboard, a merchant clicks a main category and drills down into subcategories. The product table updates with the selection, so you can see directly which individual products are pulling the category numbers up or down.
Technical Implementation
The app is built on top of Shopify's APIs and published on the Shopify App Store. It uses Shopify's Admin API to fetch order, product, and navigation data. The hierarchy is formed automatically by analyzing the main menu's link structure — the merchant doesn't need to do any configuration.
In the development team, my role covers product design, defining the analytics logic, marketing, and business. A freelance developer handles the programming.
Result
The app is published on the Shopify App Store and available to all Shopify stores. Pricing starts at $9/month and includes a free trial. The app's core promise is that a merchant gets category analytics without a single manual step — installation and the first report are ready in minutes.
What I Learned
Talk about the customer's problem, not your product's features
This has been the single biggest learning from this project. My original marketing message talked about "automatic hierarchy analysis" and "collection-level performance metrics." Technically accurate, but a merchant isn't looking for hierarchy analysis — they want to know which categories to invest in.
A concrete example: "Sales per Products Online metric per collection" tells a merchant nothing. But "Home generates 4.5x more per product than Kids — are you still advertising Kids the most?" is a sentence that makes a merchant stop and think. Same data, different framing, completely different reaction.
Build less, validate more
I developed the app for a long time before testing whether anyone actually wanted to pay for it. In hindsight, I could have validated demand faster — for example, by offering a manual report to a few merchants before a single line of code was written.
Marketing isn't a separate phase — it's part of the product
In the App Store, the app competes with hundreds of other analytics tools. A great product alone isn't enough — a merchant needs to understand in three seconds why this particular app solves their problem. This means every screenshot, every line of text, and every pricing page is a marketing decision.